lennar...@gmail.com
2020-07-27 08:00:23 UTC
Hello,
I would like to draw a mixed Polar an linear plot with gnuplot like it is done in this image:
Loading Image...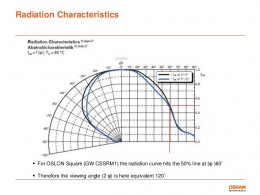
The data comes from a data file (angle vs value) and is the same for positive and negative angles.
Data:
---------------
-100 0.01
-90 0.04
-80 0.07
-70 0.15
-60 0.18
-50 0.3
-40 0.5
-30 0.65
-20 0.82
-10 0.95
0 1
10 0.95
20 0.82
30 0.65
40 0.5
50 0.3
60 0.18
70 0.15
80 0.07
90 0.04
100 0.01
--------------
So far I did come up with this script, but I do not know how to rotate the plot to have 0° at the top. And how to combine with a linear plot.
--------------
set terminal svg size 500,500
set output 'C:\Program Files\gnuplot\output.svg'
unset border
set polar
set angles degree
set grid polar 10
set grid ls 0.2
set xrange [-1:1]
set yrange [0:1]
set trange [-90:90]
set xtics axis
set ytics axis
set xtics ("" 0.2, "" 0.4, "" 0.6, "" 0.8, "" 1.0)
set ytics 0.2, 0.1, 1.0
set ttics -90, 10, 90
set ttics format "%g".GPVAL_DEGREE_SIGN
set ttics font ":Italic"
set mttics 3
set size ratio 0.5 # twice as wide as high
set title 'Radiaton Characteristics'
plot 'C:\Program Files\gnuplot\data.csv' notitle with lines
--------------
Any tipps are appreciated,
Best regards
Lennart
I would like to draw a mixed Polar an linear plot with gnuplot like it is done in this image:
Loading Image...

The data comes from a data file (angle vs value) and is the same for positive and negative angles.
Data:
---------------
-100 0.01
-90 0.04
-80 0.07
-70 0.15
-60 0.18
-50 0.3
-40 0.5
-30 0.65
-20 0.82
-10 0.95
0 1
10 0.95
20 0.82
30 0.65
40 0.5
50 0.3
60 0.18
70 0.15
80 0.07
90 0.04
100 0.01
--------------
So far I did come up with this script, but I do not know how to rotate the plot to have 0° at the top. And how to combine with a linear plot.
--------------
set terminal svg size 500,500
set output 'C:\Program Files\gnuplot\output.svg'
unset border
set polar
set angles degree
set grid polar 10
set grid ls 0.2
set xrange [-1:1]
set yrange [0:1]
set trange [-90:90]
set xtics axis
set ytics axis
set xtics ("" 0.2, "" 0.4, "" 0.6, "" 0.8, "" 1.0)
set ytics 0.2, 0.1, 1.0
set ttics -90, 10, 90
set ttics format "%g".GPVAL_DEGREE_SIGN
set ttics font ":Italic"
set mttics 3
set size ratio 0.5 # twice as wide as high
set title 'Radiaton Characteristics'
plot 'C:\Program Files\gnuplot\data.csv' notitle with lines
--------------
Any tipps are appreciated,
Best regards
Lennart