scandari
2022-09-26 20:22:39 UTC
Hello, I'm new to gnuplot. Want to obtain this sort of plot: Loading Image...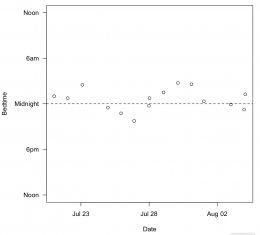
This is my code but I can't change y scale :(
----------
$TIMES << EOT
2019-01-08 00:14
2019-05-08 03:14
2019-05-07 22:08
2019-08-07 22:08
EOT
set xtics time format "%m/%d"
set ytics time format "%H:%M"
set xlabel "Date (mm/dd)" font "Times, 12"
set ylabel "Time Of Day(hh:mm)" font "Times, 12"
set key tmargin reverse Left
set xrange [strptime("%Y-%m-%d","2019-01-01"):strptime("%Y-%m-%d","2019-10-30")]
plot $TIMES using (timecolumn(1,"%Y-%m-%d")) : (timecolumn(2,"%H:%M")) with points
-----------
Do you have suggestions? Thanks.